
How to Run Your First Kompmodo Report
A step by step guide to testing Kompmodo by running a report on a house you've already sold.
 Laurel BrunkPublished Updated 8 min read

In one sitting, go from an MLS number to a branded pricing guide your seller can open from a link. You'll also have a chance to build trust: test us on a home you've listed and sold, and see whether the range lands in the right place.
A report normally takes about 10 minutes. This first one will take longer while you get the hang of the process.
Before you start
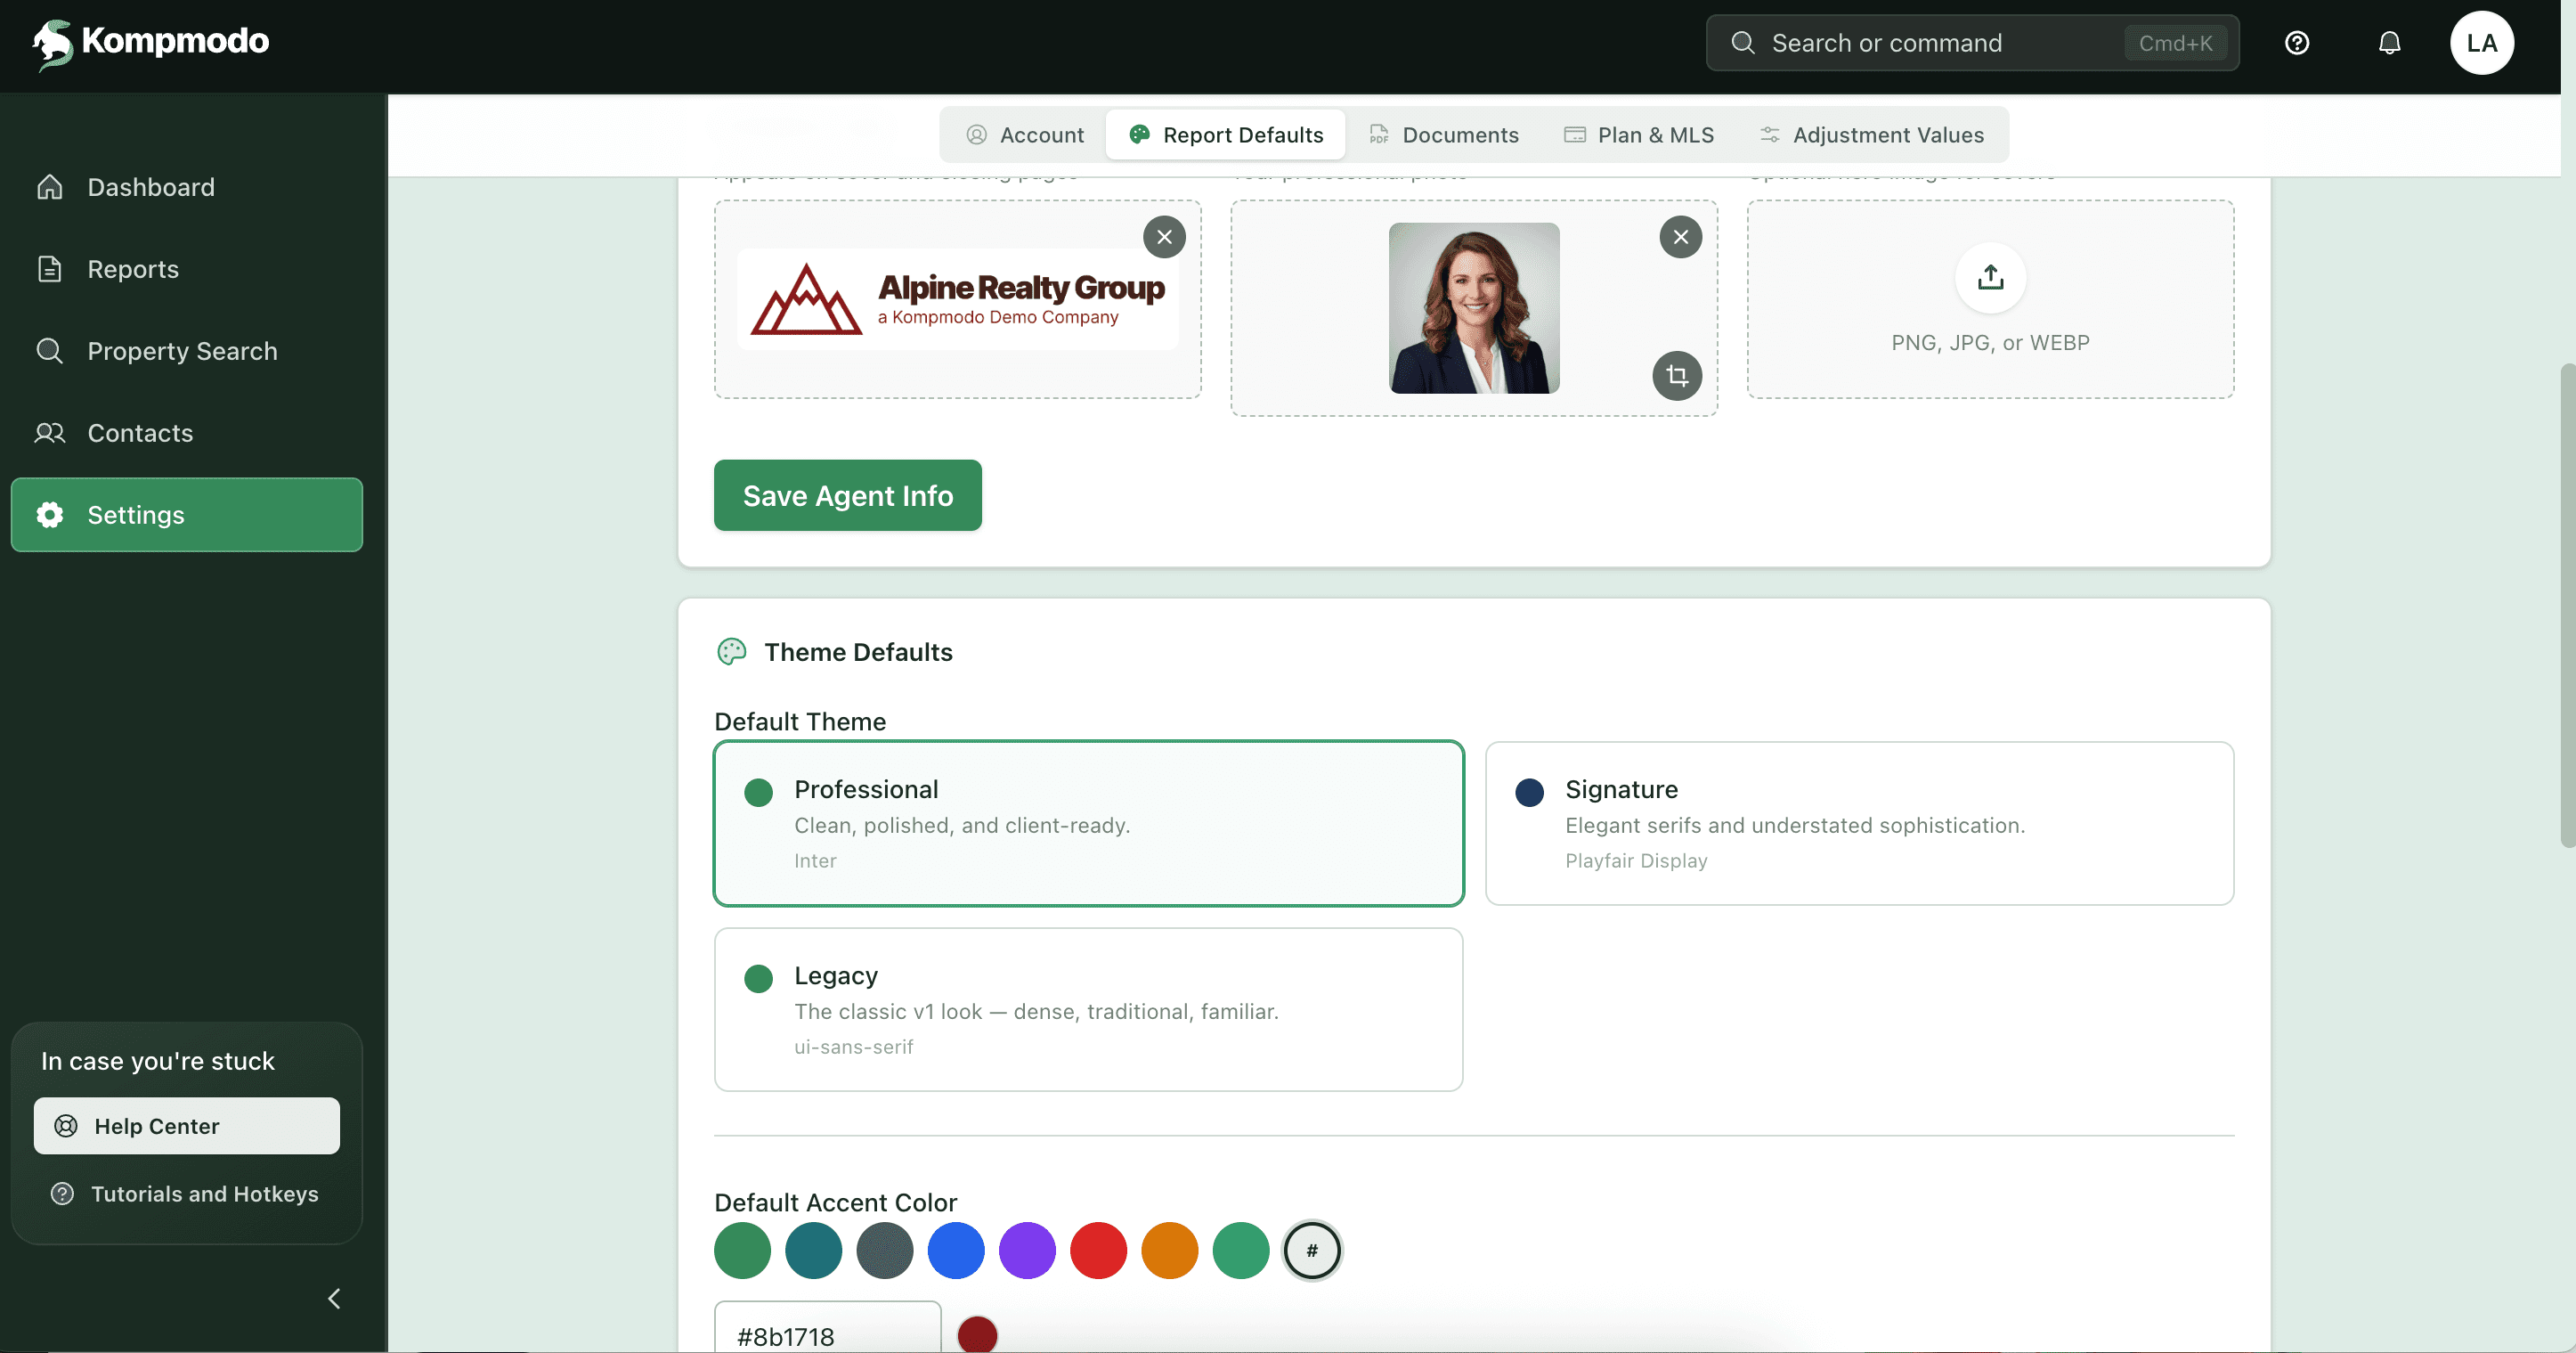
The first time you log in, set up your branding and system preferences. Click Settings in the left sidebar, or Your profile under your name icon in the upper right-hand corner.
You can set many preferences there, but for this first run, just get the Report Defaults to fit your brand: update your photo, logo and colors, and choose the report style you prefer.
Have ready:
The MLS number (or address) of a house you priced and sold recently.
A client name to attach the report to. A placeholder is fine for a first run.
How the tool flows
The report moves left to right through five tabs at the top of the screen:
Subject → Compare → Market → Report → Share
The green button in the bottom-right corner always takes you to the next one.
Step 1 — Start the report
From the Dashboard, click + New Report (top right). Then fill in the card at the top of the Subject tab:

Report name — your own label (for example, "Booth – Listing 2026"). Your client never sees it.
Client — add the client, then choose Seller or Buyer.
Purpose — choose Unsolicited CMA, Listing Appointment CMA, Real Estate Review, Buyer Valuation or Tax Assessment Protest. You can filter by report type on your Dashboard.
Follow-up — set a date. It puts this report on your Dashboard's follow-up list, so set one now.
Step 2 — Subject: bring in the house
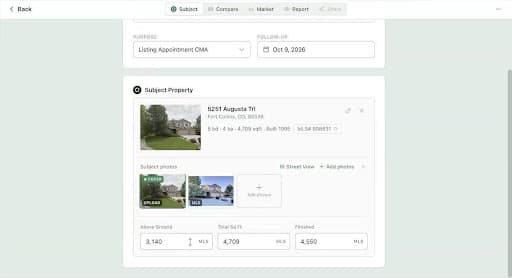
Under Subject Property, type the MLS number and click Look up. You can also search by address, or choose Or search on map.
Check the summary line (beds, baths, square feet, year built, MLS#). The Above Ground, Total Sq Ft and Finished fields are filled from MLS. Correct them here if you know better, because every adjustment downstream depends on them.
Set the cover photo. The MLS photo is there already. Click Street View to frame the house yourself, then Set as cover, or use Add photos to upload your own. The cover is the first thing your seller sees.
Click Compare (bottom right).
Step 3 — Compare: choose comps and read the ModoMatrix
The Compare tab opens the ModoMatrix, an adjustment grid with your subject in the first column and each comp beside it. Add comps three ways from the top right:
Auto Find Comps — Kompmodo proposes a set. It's a fast way to start, built on sound logic, and you can still remove any of them.
Add MLS number — paste in a comp you already have in mind.
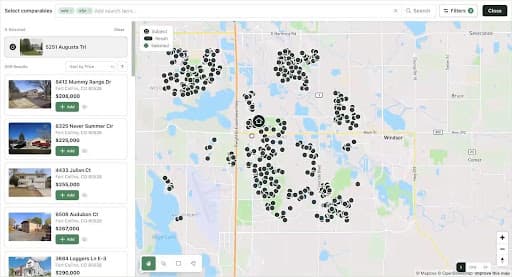
Search on Map — explore the area and pick comps yourself.
Picking comps on the map
Click Filters and narrow the search: status (Sold, Active, Pending, Expired, Withdrawn), sold within (30 days to 3 years), home type, style, price, beds, baths, square feet, year built, lot size and garage. The chip on the right of each filter matches the subject's own value in one click, such as Same style only. Click Show [N] properties.
Use the drawing tools at the bottom of the map to draw a box or a custom shape around the neighborhood you'd use. Results narrow to that area.
Click + Add on a listing card, or open the listing to see every photo and the full MLS detail, then click + Add as Comparable.
Click Done to return to the grid.
Keyboard shortcuts in the listing viewer
Key | Action |
|---|---|
← → | Previous / next photo |
↑ ↓ | Previous / next property |
Space | Add as a comp |
C | Copy the MLS# |
I | Toggle the side panel |
Esc | Close |
Reading the grid
Each row shows the comp's feature and the dollar adjustment beside it. Green adds to the comp's price because the comp has less than your subject. Red subtracts because it has more. The grid is grouped into:
Interior Details — bedrooms, baths, family/living/great rooms, study, rec room, garage, fireplace, central AC.
Property Specs — above-ground, basement, total and finished square feet; year built; lot size.
Property Attributes — Updates, Condition, Construction Quality, Lot Desirability and Landscaping, each rated 1–5. Rate the subject in its column. To rate a comp, click its photo and use the Adjustments panel; the comp's photos are right there to judge from.
Sale Information — sold date, days to offer, list price, sold price.
Custom Adjustments — Add Row for anything the grid doesn't cover, or Browse Common for ready-made rows such as walkout basement, concessions or solar panels.
Notes — one line per comp (for example, "Multiple offers"). These travel into the report.
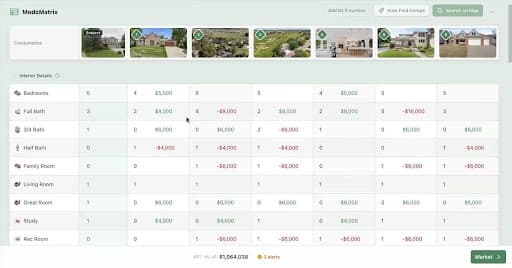
Changing an adjustment value: click the value and edit it. By default the change applies to every comp, which keeps the grid consistent. You can also apply it to a single comp when one house is the exception.
Removing a comp: click the × on its photo. An Undo appears for a few seconds.
The number at the bottom
Scroll to the end of the grid. Each comp shows Total Adjustments, Sold Price and Adjusted Price. Estimated Value is the average of the adjusted prices. It also shows live as EST. VALUE in the bottom bar while you work.
Enter your Estimated Market Value Range (Min to Max). This is the range your seller will see, and it is yours to set.
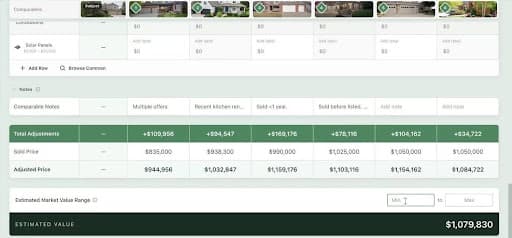
Now compare it with the number you remember. If it's off, the grid shows you which comp or which adjustment is pulling it.
Step 4 — Market: define the market in ModoVision
Comps explain the price; ModoVision explains the market around it: supply and demand, absorption, days on market, and where your subject sits on the price-per-square-foot trend.
Click Define the market, or Auto Select to let Kompmodo draw it for you.
On the map, draw the area your seller thinks of as their neighborhood, usually the subdivision. Adjust Filters if needed (the default is the last 12 months).
Click Use this market. Review the property count, give the market a name your seller will recognize (for example, the subdivision name), and confirm.
ModoVision then builds these charts, and you can hide any that don't serve your client:
Market Activity — active, sold and did-not-sell listings, with average prices.
Absorption Rate — months of inventory, on a seller's / balanced / buyer's market scale.
Price per square foot (total, finished and above-ground) — a trendline with your subject marked, and the price the trendline implies for it.
Current Price Landscape — for-sale and recently sold homes side by side, with the middle 50% of prices, the median and your subject.
Days on Market, Market Pace & Competition and Time to Contract (for example, "50% by 25 days").
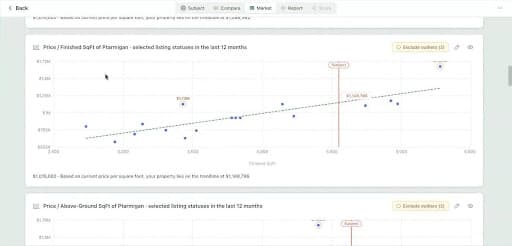
Every scattergram is interactive: hover over a dot to see which house it represents.
Review before you move on
Exclude outliers on the scatter charts to remove points that would mislead (a teardown, an estate sale). Click any dot to open that listing; you can exclude it from the analytics there.
Check that each trendline makes sense for this neighborhood before it goes in front of a seller.
The pencil and eye icons on each chart let you edit it and control whether it appears.
Click Report when you're done.
Step 5 — Report: review what your seller will see
The Report tab assembles everything into a finished pricing guide: cover page, ModoVision market pages, your ModoMatrix and comp photos. Thumbnails run down the left; switch between Pages and Grid at the bottom to page through or see it all at once.
In the right-hand panel:
Report heading — the client-facing title on the cover. Leave it blank to use the default, Comparable Pricing Analysis. Your report name from Step 1 stays private.
Map & Photos and Photo selection — choose which images appear.
Documents — attach anything else you want in the package.
Online report and Theme & Language — how the shared version looks.
If you filled out your profile, your brokerage's logo and colors are already applied.
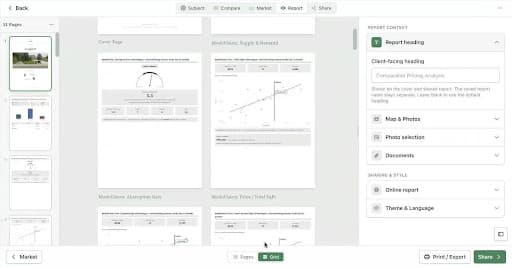
Use Print / Export if you want a copy to bring to the appointment. Click Share when it reads the way you'd present it.
Step 6 — Share: send it to your seller
The Share tab gives you a live online report: one link your seller opens in a browser, on any device. Preview it with the Phone and Desktop toggle at the bottom.
Share link — copy it or open it. The view count beside it updates as your client opens it.
QR code — download it for open houses or listing sheets.
Email to Client — a ready-to-send email with the link, your photo, logo and contact details. Click Edit to put it in your own words before you send.
Link Settings — options for the shared link.
Your seller gets a scrollable report with your name, a Call button and an Email button pinned to the bottom of every screen. They can tap through every comp's photos and hover over the charts.
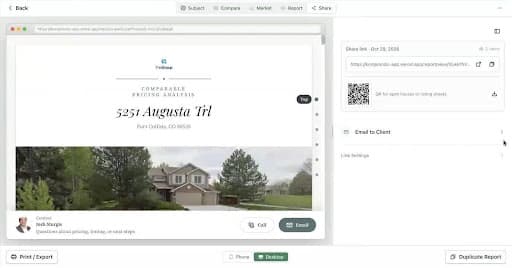
Duplicate Report (bottom right) makes a copy of this report.
After you send
The Dashboard tracks every report from draft to reply. The four counters across the top:
Counter | What it counts |
|---|---|
Drafts | Reports you started and haven't finished |
Awaiting client | Sent, not opened yet |
Viewed | Opened by the client, no reply yet |
Follow-ups | Follow-up dates that are overdue or due today |
Below them, Follow-ups lists each report with how many times it was viewed and when, such as "Viewed 2× · last 23h ago · no follow-up". Click Set follow-up to schedule your next touch. The bell at the top of the screen tells you the moment a report is viewed.
Evaluate the experience
Look again at the house you priced and sold. How did Kompmodo's range compare? We hope it gave you some peace of mind that this tool can be an asset, showcasing your expertise like never before.
If you're still unsure, drop us a line and tell us what makes you nervous. And by all means, keep testing.
Download this PDF version for continued reference.